How To Track Visitors To Your Website: Google Analytics Explained
Understanding how to track visitors to your website is essential in order to retain and convert these visitors into leads, sales, and repeat visitors. There are several ways that you can track visitors and analyze their behavior on your website, but we are going to discuss and focus on the easiest, and most insightful platform available to webmasters: Google Analytics. More importantly, it’s also free!
What is Google Analytics?
Google Analytics is a free service offered by Google that generates in-depth statistics about visitors and sources of website traffic, while also tracking measurable data such as website conversions and sales. Website owners can analyze this data to determine which traffic sources, search engines, advertising sources, or referral sources provide the highest quality traffic to his or her website. It is the most advanced and functional web analytical program available.

Why Use Google Analytics?
Every single website owner should take advantage of Google Analytics, as the information provided is priceless in terms of helping you improve your website. Some of the more common reasons to start implementing Google Analytics today include:
Every single individual that lands on your website is different. They have different intentions, and Google Analytics allows you to analyze the behavior of your audience. This data enables you to make changes to your website in order to provide a better user experience.
Understanding where your visitors come from is just as important as understanding who they are. Google Analytics allows you to dig deep into your traffic sources as well as the visitor flow. Traffic sources identify the “where” such as search engines, other websites, or advertising sources. The visitor flow identifies the “how” and this includes information such as keywords searched to find your website and the type of device they used to browse your website. (Tip: notice that your conversion rates are lower for mobile devices than they are for desktop visitors? This is a good indication that your mobile experience needs some work, so work on delivering a more pleasant experience for these visitors. You could install a mobile optimization plugin to solve this.)
Imagine if you could see what your visitors did when they landed on your website – what pages they visited and when they left? Well, with Google Analytics you can do this and then some. Google’s flow visualization allows you to take an in-depth look into the travel path of each visitor, from where they originate all the way until they leave your website. This data can help you determine what pages and pieces of content lead to the most conversions and which ones lead to visitors bouncing from your website. A bounce is where someone views your website and leaves without looking at another page. Google Analytics also features real-time reporting, allowing you to watch your visitors live as they are on your website.

Google Analytics 3 Step Guide
Step #1: Setting Up & Installing Google Analytics
When you visit the Google Analytics sign up page it will require you to create a Google account if you don’t already have one. If you already have a gmail account then you can use those credentials to login and establish a Google Analytics account. It is very simple to get your account set up. By default, “Website” is going to be selected under “What account would you like to track?” You will need to assign a name to your account and then also enter in your website name along with the URL. Once you select your industry and reporting time zone you will then click on the “Get Tracking ID” button to generate your custom Google Analytics code.

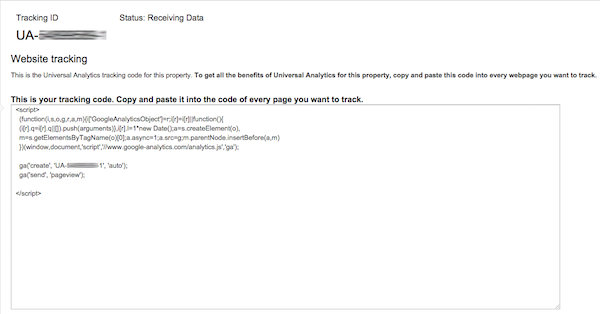
Once you complete the simple sign up process you will be able to access your unique tracking ID, which will look like this:
 Now, if you took our advice and built your website using the WordPress CMS platform you can have your Analytics tracking ID installed throughout your website with just a few clicks.
First, log into your WordPress admin area and click on the “Plugins” menu on the left-hand side of your dashboard. In the search bar located in the upper right-hand corner, enter “Google Analytics for WordPress.” The first result listed should be “Google Analytics by Yoast” which is by far the best plugin to integrate your tracking ID. Click on the “Install Now” button to install the plugin.

Once you have installed your new plugin click on the “Analytics” tab in your WordPress dashboard and navigate to the “General” tab. Tick the box to manually enter your tracking ID and place your code, which starts with “UA” followed by a series of digits. Also, make sure that you tick the box to enable outbound clicks and downloads and then click the button to authenticate the plugin with your Google Analytics account. Once completed make sure to click the “Save Changes” button and you are done!

Once you have saved the changes to your plugin you will want to log into your Analytics account to make sure the code was installed properly. Navigate back to the screen where you got your tracking ID and make sure the status is now displaying as “Receiving Data.” Your account is now set up properly and Google is receiving data from your website. Now, move to step two below to set up your website goals and conversion tracking.
Step #2: Set Up Goals & Conversion Tracking
By simply just installing your Analytics tracking ID as outlined in step number one above you can see how many visitors you website had on any given day, where they came from, what they did while they were on your website, and how long they stayed before leaving. While this is great data, you also need to know how many of them did what you want them to do while they were on your site. Things like eBook downloads, contact form submissions, newsletter registrations, or purchases are all things that you can also track with Google Analytics.
 Every website is going to have different goals when it comes to conversions. Some websites are set up to collect leads, while some are looking to convert their visitors into sales. The first step is to define what your goals are. Your goals are the reason your website exists and why you built it in the first place. Some websites will have a single goal while others will have a sequence of goals that all lead to the final goal.
A blog that publishes articles that contain affiliate links will have the goal of increasing its readership, so they would want to build their blog subscriber list. They would identify their goal as an email submit to their subscription base. A website that is selling a digital download product would also have an second goal in addition to the purchase. They would also want to collect leads in order to continue to market their offer to those that leave without purchasing during their first visit.
Destination Goals
The easiest goal to set up is a URL destination goal, which is how most websites track sales, sign ups, and subscriptions. When a visitor completes a purchase on a website they are typically sent to a “Thank You” page, and this is the URL that you would want to track, as it confirms the purchase. The same concept applies for a digital download or newsletter sign up. The URL that the visitor is sent to upon completing the action is always going to be the goal.
Learn How to Set Up a Destination URL Goal
You will first need the complete URL of the “Thank You” page your visitor is sent to. While in your Analytics dashboard you will want to follow this path:
Admin > Goals > New Goal
Now, you will see several options including Revenue, Acquisition, Inquiry, Engagement, or Custom. You will want to select the one that best describes your goal. For this example, let’s assume we are creating a goal to track the visitors who complete our “Contact Us” form.
 Once you select the appropriate goal you will want to click on “Next Step” to complete your goal description. You can assign any name you wish, but to keep it simple we will name our goal “Contact Us” for this example. You need to also select the type, and for our example we would select “Destination” as we will use our Thank You page confirmation URL to trigger the conversion goal.

Clicking “Next Step” again will now allow you to enter details about your goal. This is where you will input the URL that you want to assign to the goal. If you were creating a goal for a purchase of a particular product you could also assign a dollar value to the goal. This is especially helpful if you are running paid traffic, as it will let you know if you are running a profitable campaign. When you are finished click on “Create Goal” to make it live.

Once you have successfully set up each goal make sure that you run some tests to confirm that Analytics is tracking and recording your goals properly. It will show you the number of conversions over the past 7 days by default. You are allowed to create a total of 20 goals within your account.

Monitor Your Goals
Once you create all of your goals and have them set up properly you will need to learn how to monitor them. You can locate your stats by following this path:
Conversions > Goals
This data will show you how many times each goal occurred during any specific period of time that you select. Digging into this data will allow you to determine what traffic sources are converting the best for each goal, allowing you to change and adapt your traffic generation strategy to result in more conversions. Take your time to set up your goals correctly, as they are the most important aspect of your website. Move on to step three below to learn how to analyze your website interaction.

Step #3: Analyze Website Interaction
While the goals that we discussed in step two above are extremely helpful, they are only a small fraction of the benefits that Google Analytics offers you as a website owner. Understanding your website bounce rate, what geographic locations are producing the highest quality traffic, and what pieces of content on your website are the most popular will all help you improve your website and reach your goals.
What is Bounce Rate?
Bounce rate refers to the percentage of visitors that leave your website without engaging with any additional pages of content. A high bounce rate will typically mean that your visitors are not interested in what your website offers or they found the navigation difficult. A low bounce rate is always the goal, so you will want to identify which traffic sources are providing the quality of visitors that are interested in your offer and tend to stick around.
In your Analytics dashboard you will want to click on the “Acquisition” tab and then the “ALL Referrals” sub-tab. This will show you all of your referral traffic and you can see the bounce rate from each. In the example below you will see that the bounce rate is very good across the board, but there can always be improvements, so we would want to look into the traffic source that was producing the 26% bounce rate and see if we can do anything to improve the user experience for that source.
 If a paid traffic source is producing a high bounce rate then you will want to move that advertising spend into areas that are delivering traffic that is engaging with your website and converting to leads, sign ups or sales. If the bounce rate is high across the board that will typically be a sign that your landing page needs to be more appealing and provide a better user experience.
What is a Good Bounce Rate On a Website?
Naturally you are going to want to know what a good bounce rate is, but this is difficult to answer with a number. Most websites will fall between 25 and 60 percent, with websites with thin content having a higher bounce rate. Instead of just throwing a number out there we will say that a good bounce rate is one that is constantly decreasing month after month until it is below the 10 percent mark. If you are constantly making an effort to improve the usability of your website then you should see your bounce rate become lower over time.
How to Find Out What Country Your Readership is From
To find out where your website traffic is coming from, simply click on the “Audience” tab within your Google Analytics dashboard, followed by the “Geo” and “Location” sub-tabs. This will display all of the Countries that your visitors come from. You can then look at individual data broken down by country, including bounce rate, how many pages they viewed per session and how long the average visitor form each country stayed on your website.
Looking at the example below we can see that just over half of the traffic is coming from the United States while less than one percent is coming from Ireland. This type of data can really help you understand what countries are interested in what you are offering, allowing you to cater future marketing towards the audiences that are more active on your website.

How to Find Out What Your Most Popular Post Is
Understanding what website content receives the most traffic is a great way to identify the topics and type of content that your audience responds the best to. When you are logged into your Google Analytics account click on the “Behavior” tab, followed by “Site Content” and then “All Pages” to display your most popular pages. Naturally, your home page will be your most popular page just like the example below demonstrates. Use this data to help identify potential for future blog posts and topics. For instance, if you notice that your list posts or how-to posts attract the most interest then continue to publish content structured the same way.

What is The Difference Between an Entrance, Session and Page View?
When a visitor first lands on your website it is recorded as an “Entrance” and to make it simple just think of this value as the very first page view during a visit. No matter what other pages your visitor goes to there will not be any other “Entrances” recorded during their visit. A “Page View” is recorded every time the visitor navigates to a new page, and this number will continue to accumulate as long as they stay on the website. A “Session” is only recorded on the very first page of the visit.
Let’s assume that you have a visitor that lands on your website and visits just two pages before they leave. It would look like this:
Enter Website > Page 1 > Page 2 > Leave Website
The data in your Analytics would be:
Page 1: 1 Entrance, 1 Session, and 1 Page View
Page 2: 0 Entrances, 0 Sessions, and 1 Page View
Source: monetizepros
Need tips on how to successfully manage your Virtual Assistant? Browse our website www.callarup.com to see the different skill sets of the personal assistant you can work with and let us know how we can help.
What is Google Analytics?
Google Analytics is a free service offered by Google that generates in-depth statistics about visitors and sources of website traffic, while also tracking measurable data such as website conversions and sales. Website owners can analyze this data to determine which traffic sources, search engines, advertising sources, or referral sources provide the highest quality traffic to his or her website. It is the most advanced and functional web analytical program available.
Why Use Google Analytics?
Every single website owner should take advantage of Google Analytics, as the information provided is priceless in terms of helping you improve your website. Some of the more common reasons to start implementing Google Analytics today include:
- Google Analytics allows you to learn more about your audience.
Every single individual that lands on your website is different. They have different intentions, and Google Analytics allows you to analyze the behavior of your audience. This data enables you to make changes to your website in order to provide a better user experience.
- Discover where your most valuable visitors come from.
Understanding where your visitors come from is just as important as understanding who they are. Google Analytics allows you to dig deep into your traffic sources as well as the visitor flow. Traffic sources identify the “where” such as search engines, other websites, or advertising sources. The visitor flow identifies the “how” and this includes information such as keywords searched to find your website and the type of device they used to browse your website. (Tip: notice that your conversion rates are lower for mobile devices than they are for desktop visitors? This is a good indication that your mobile experience needs some work, so work on delivering a more pleasant experience for these visitors. You could install a mobile optimization plugin to solve this.)
- Understand what your visitors do while they are on your website.
Imagine if you could see what your visitors did when they landed on your website – what pages they visited and when they left? Well, with Google Analytics you can do this and then some. Google’s flow visualization allows you to take an in-depth look into the travel path of each visitor, from where they originate all the way until they leave your website. This data can help you determine what pages and pieces of content lead to the most conversions and which ones lead to visitors bouncing from your website. A bounce is where someone views your website and leaves without looking at another page. Google Analytics also features real-time reporting, allowing you to watch your visitors live as they are on your website.
Google Analytics 3 Step Guide
Step #1: Setting Up & Installing Google Analytics
When you visit the Google Analytics sign up page it will require you to create a Google account if you don’t already have one. If you already have a gmail account then you can use those credentials to login and establish a Google Analytics account. It is very simple to get your account set up. By default, “Website” is going to be selected under “What account would you like to track?” You will need to assign a name to your account and then also enter in your website name along with the URL. Once you select your industry and reporting time zone you will then click on the “Get Tracking ID” button to generate your custom Google Analytics code.
Once you complete the simple sign up process you will be able to access your unique tracking ID, which will look like this:
First, log into your WordPress admin area and click on the “Plugins” menu on the left-hand side of your dashboard. In the search bar located in the upper right-hand corner, enter “Google Analytics for WordPress.” The first result listed should be “Google Analytics by Yoast” which is by far the best plugin to integrate your tracking ID. Click on the “Install Now” button to install the plugin.
Once you have installed your new plugin click on the “Analytics” tab in your WordPress dashboard and navigate to the “General” tab. Tick the box to manually enter your tracking ID and place your code, which starts with “UA” followed by a series of digits. Also, make sure that you tick the box to enable outbound clicks and downloads and then click the button to authenticate the plugin with your Google Analytics account. Once completed make sure to click the “Save Changes” button and you are done!
Once you have saved the changes to your plugin you will want to log into your Analytics account to make sure the code was installed properly. Navigate back to the screen where you got your tracking ID and make sure the status is now displaying as “Receiving Data.” Your account is now set up properly and Google is receiving data from your website. Now, move to step two below to set up your website goals and conversion tracking.
Step #2: Set Up Goals & Conversion Tracking
By simply just installing your Analytics tracking ID as outlined in step number one above you can see how many visitors you website had on any given day, where they came from, what they did while they were on your website, and how long they stayed before leaving. While this is great data, you also need to know how many of them did what you want them to do while they were on your site. Things like eBook downloads, contact form submissions, newsletter registrations, or purchases are all things that you can also track with Google Analytics.
A blog that publishes articles that contain affiliate links will have the goal of increasing its readership, so they would want to build their blog subscriber list. They would identify their goal as an email submit to their subscription base. A website that is selling a digital download product would also have an second goal in addition to the purchase. They would also want to collect leads in order to continue to market their offer to those that leave without purchasing during their first visit.
Destination Goals
The easiest goal to set up is a URL destination goal, which is how most websites track sales, sign ups, and subscriptions. When a visitor completes a purchase on a website they are typically sent to a “Thank You” page, and this is the URL that you would want to track, as it confirms the purchase. The same concept applies for a digital download or newsletter sign up. The URL that the visitor is sent to upon completing the action is always going to be the goal.
Learn How to Set Up a Destination URL Goal
You will first need the complete URL of the “Thank You” page your visitor is sent to. While in your Analytics dashboard you will want to follow this path:
Admin > Goals > New Goal
Now, you will see several options including Revenue, Acquisition, Inquiry, Engagement, or Custom. You will want to select the one that best describes your goal. For this example, let’s assume we are creating a goal to track the visitors who complete our “Contact Us” form.
Clicking “Next Step” again will now allow you to enter details about your goal. This is where you will input the URL that you want to assign to the goal. If you were creating a goal for a purchase of a particular product you could also assign a dollar value to the goal. This is especially helpful if you are running paid traffic, as it will let you know if you are running a profitable campaign. When you are finished click on “Create Goal” to make it live.
Once you have successfully set up each goal make sure that you run some tests to confirm that Analytics is tracking and recording your goals properly. It will show you the number of conversions over the past 7 days by default. You are allowed to create a total of 20 goals within your account.
Monitor Your Goals
Once you create all of your goals and have them set up properly you will need to learn how to monitor them. You can locate your stats by following this path:
Conversions > Goals
This data will show you how many times each goal occurred during any specific period of time that you select. Digging into this data will allow you to determine what traffic sources are converting the best for each goal, allowing you to change and adapt your traffic generation strategy to result in more conversions. Take your time to set up your goals correctly, as they are the most important aspect of your website. Move on to step three below to learn how to analyze your website interaction.
Step #3: Analyze Website Interaction
While the goals that we discussed in step two above are extremely helpful, they are only a small fraction of the benefits that Google Analytics offers you as a website owner. Understanding your website bounce rate, what geographic locations are producing the highest quality traffic, and what pieces of content on your website are the most popular will all help you improve your website and reach your goals.
What is Bounce Rate?
Bounce rate refers to the percentage of visitors that leave your website without engaging with any additional pages of content. A high bounce rate will typically mean that your visitors are not interested in what your website offers or they found the navigation difficult. A low bounce rate is always the goal, so you will want to identify which traffic sources are providing the quality of visitors that are interested in your offer and tend to stick around.
In your Analytics dashboard you will want to click on the “Acquisition” tab and then the “ALL Referrals” sub-tab. This will show you all of your referral traffic and you can see the bounce rate from each. In the example below you will see that the bounce rate is very good across the board, but there can always be improvements, so we would want to look into the traffic source that was producing the 26% bounce rate and see if we can do anything to improve the user experience for that source.
What is a Good Bounce Rate On a Website?
Naturally you are going to want to know what a good bounce rate is, but this is difficult to answer with a number. Most websites will fall between 25 and 60 percent, with websites with thin content having a higher bounce rate. Instead of just throwing a number out there we will say that a good bounce rate is one that is constantly decreasing month after month until it is below the 10 percent mark. If you are constantly making an effort to improve the usability of your website then you should see your bounce rate become lower over time.
How to Find Out What Country Your Readership is From
To find out where your website traffic is coming from, simply click on the “Audience” tab within your Google Analytics dashboard, followed by the “Geo” and “Location” sub-tabs. This will display all of the Countries that your visitors come from. You can then look at individual data broken down by country, including bounce rate, how many pages they viewed per session and how long the average visitor form each country stayed on your website.
Looking at the example below we can see that just over half of the traffic is coming from the United States while less than one percent is coming from Ireland. This type of data can really help you understand what countries are interested in what you are offering, allowing you to cater future marketing towards the audiences that are more active on your website.
How to Find Out What Your Most Popular Post Is
Understanding what website content receives the most traffic is a great way to identify the topics and type of content that your audience responds the best to. When you are logged into your Google Analytics account click on the “Behavior” tab, followed by “Site Content” and then “All Pages” to display your most popular pages. Naturally, your home page will be your most popular page just like the example below demonstrates. Use this data to help identify potential for future blog posts and topics. For instance, if you notice that your list posts or how-to posts attract the most interest then continue to publish content structured the same way.
What is The Difference Between an Entrance, Session and Page View?
When a visitor first lands on your website it is recorded as an “Entrance” and to make it simple just think of this value as the very first page view during a visit. No matter what other pages your visitor goes to there will not be any other “Entrances” recorded during their visit. A “Page View” is recorded every time the visitor navigates to a new page, and this number will continue to accumulate as long as they stay on the website. A “Session” is only recorded on the very first page of the visit.
Let’s assume that you have a visitor that lands on your website and visits just two pages before they leave. It would look like this:
Enter Website > Page 1 > Page 2 > Leave Website
The data in your Analytics would be:
Page 1: 1 Entrance, 1 Session, and 1 Page View
Page 2: 0 Entrances, 0 Sessions, and 1 Page View
Source: monetizepros
Need tips on how to successfully manage your Virtual Assistant? Browse our website www.callarup.com to see the different skill sets of the personal assistant you can work with and let us know how we can help.